8. Debug a plugin
8.1. Application Log level
Log level is defined in the [log] section of the ~/config/config.ini file of the module.
There are 2 parameters :
minimal_level[DEV]: log level in development environment (plugin installed as dev build). default value is
DEBUGminimal_level: log level in production environment. default value is
INFO
You can change the log level. After changing it, you have to stop and start MFSERV to reload the configuration, by entering the commands :
either
mfserv.stop
mfserv.start
or (as root user)
service metwork restart mfserv
See also
mfadmin:mfadmin_miscellaneous:Exporting logsmfadmin:mfadmin_monitoring_plugins
8.2. Nginx Access Log
Nginx writes logs information in the access log regarding each request made by a client.
By default, these access logs are enaable. But you can prevent Nginx Access Log from being writtent by setting logging parameter in the [nginx] section of the ~/config/config.ini file of the module:
# If logging=0, do not log anything in nginx_access.log
logging=1
8.3. Interactive debugger
An interactive debugger is available for python3_sync, python2_sync and aiothhp plugin type created with the default plugin template.
In order to show you how it works, follow the instruction below.
Create a plugin with the default template:
bootstrap_plugin.py create testdyndebug
When Select type is asked, choose 1 (python3_sync - the default choice):
 Select type:
1 - python3_sync
2 - python2_sync
3 - aiohttp
4 - gunicorn3_sync
5 - gunicorn2_sync
6 - gunicorn3_asyncio
Choose from 1, 2, 3, 4, 5, 6 [1]:
Set the debug parameter to 1 (instead of 0) in the [app_...] section of the plugin config.ini file:
# if you set debug=1, then you will get an interactive debugger
# when you got an exception in your code
# (max age will also be automatically set to 0 and mflog minimal level will be
#  set to DEBUG)
# DON'T USE IT ON PRODUCTION!!!
debug=1
Then, when your plugin is created, edit the main/wsgi.py script an raise intentionally an error:
from mflog import get_logger

logger = get_logger("myapp")

def application(environ, start_response):
    status = '200 OK'
    output = b'Hello World!'
    logger.info("this is a test message")
    # Raise intentionnally an excetion
    x = 1/0
    response_headers = [('Content-Type', 'text/plain'),
                        ('Content-Length', str(len(output)))]
    start_response(status, response_headers)
    return [output]
Build the plugin by entering the make develop command. You should notice because the debug parameter is set to 1, a warning message is displayed:
Output:

...
WARNING: this plugin has a debug == 1 setting for the app: main
  => This is a dangerous plugin which can break the whole
     mfserv module
  => But it can be assumed if you trust the author
Then, run and check your application from a browser by entering the application url http://{your_host_name}:18868/testdyndebug (e.g.: http://localhost:18868/testdyndebug)*[]:
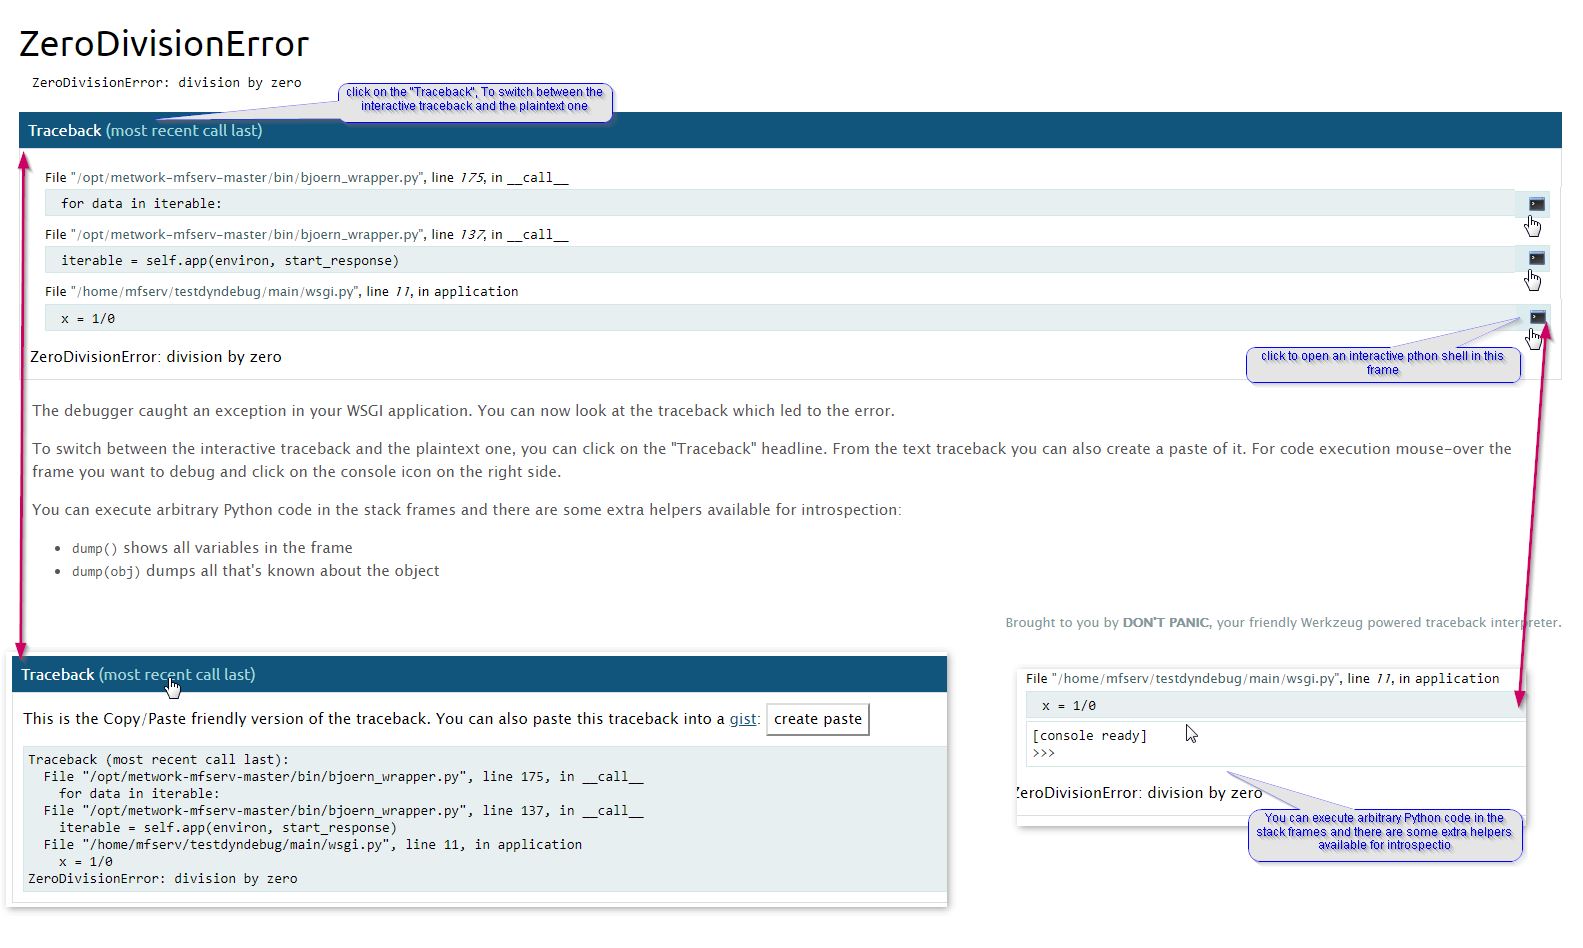
You should see an HTML page containing the stack trace of the application error like this:

Note
If you are running a Django project plugin, the debug HTML page is sightly different and you can’t execute arbitrary python code in the stack frames. containingWe will called it foo_django. to initialize a plugin containing
8.4. Entering the plugin environment
In some cases, you would like to run commands from your plugin environment, e.g. django command line.
In order to do this, run the command plugin_env from the root directory of the plugin.
Then, you have entered the environment of your plugin and you are able to run commands through a command line in this plugin environment.