What is MFADMIN?
This is the Metwork Framework ADMIN module. This module hosts off-the-shelf software for storing and visualizing metrics and logs.
Important
It's a passive module. It does not connect to anything. You have to feed it with metrics and logs.
For system metrics, you can install and use a MFSYSMON module.
For other metrics, use the corresponding MetWork module:
- MFSERV for http logs/metrics
- MFDATA for data processing logs/metrics
- [...]
And configure them to send their logs/metrics to this MFADMIN module (locally or through the network).
How to configure a MetWork module to send its logs/metrics to MFADMIN?
Open the MetWork module (mfserv, mfdata...) configuration file and have a look to the [admin] configuration group. In most cases, you only need to configure the hostname key under this group.
What about if I want to feed a MFADMIN from outside a MetWork module?
Feeding MFADMIN directly from outside a MetWork module is not supported and completly discouraged.
To do that, you have to use an "extension point" from the MFSYSMON module. With this feature, you have send your custom logs/metrics to MFSYSMON and it will take care of communicating with MFADMIN.
MFADMIN is splitted in two optional layers:
metwork-mfadmin-layer-metrics: for metrics storage (InfluxDB) and visualizing (Grafana).metwork-mfadmin-layer-logs: for logs storage (ElasticSearch) and visualizing (Kibana).
Of course, you can install the first layer, the second one or both!
What about if I don't install any of these layers?
If you install MFADMIN module with a simple yum install metwork-mfadmin (or something similar),
you get a minimal installation of MFADMIN module. So you don't have any extra layer. Your module
works but is completly useless. So be sure to add a layer for metrics, logs or both!
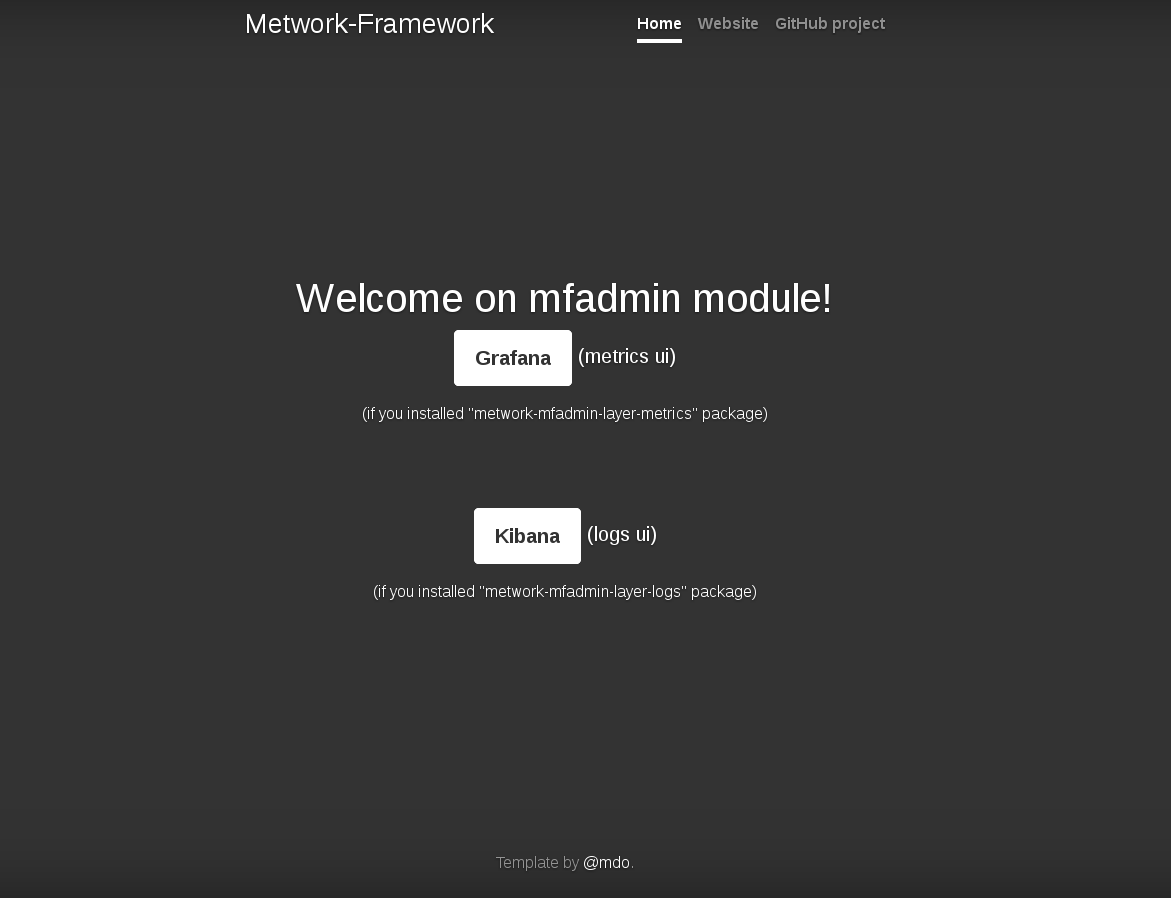
** The welcome screen of MFADMIN with two choices: metrics ui or logs ui **
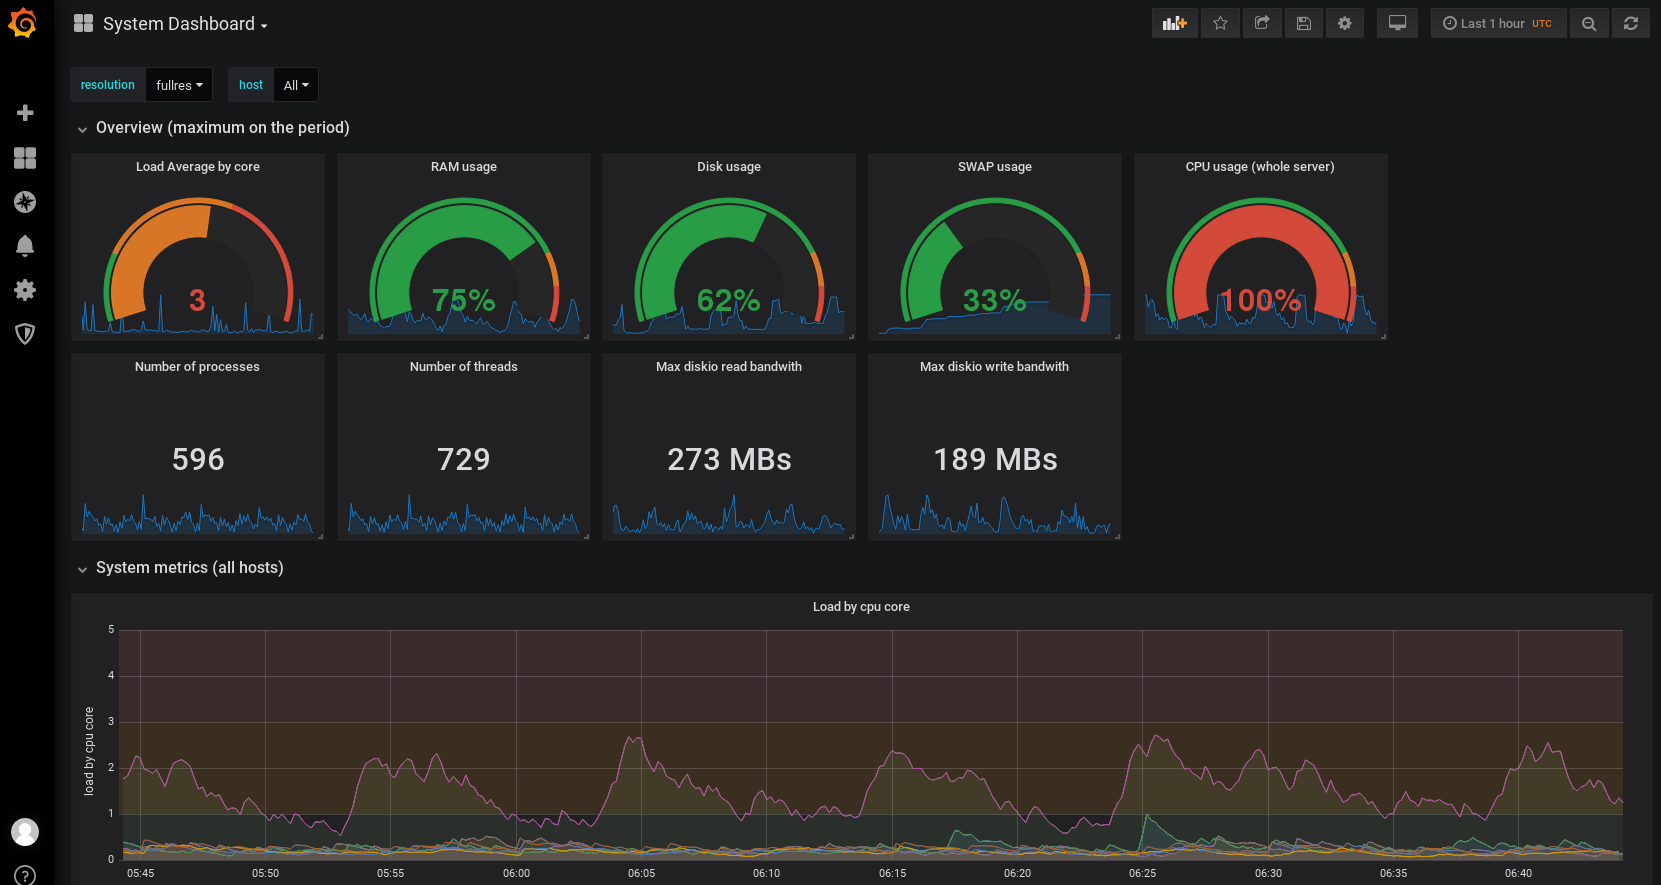
** A "system" dashboard in the metrics ui provided with MFADMIN (of course, you can build/use your custom dashboards but we provide some interesting dashboards out of the box). **
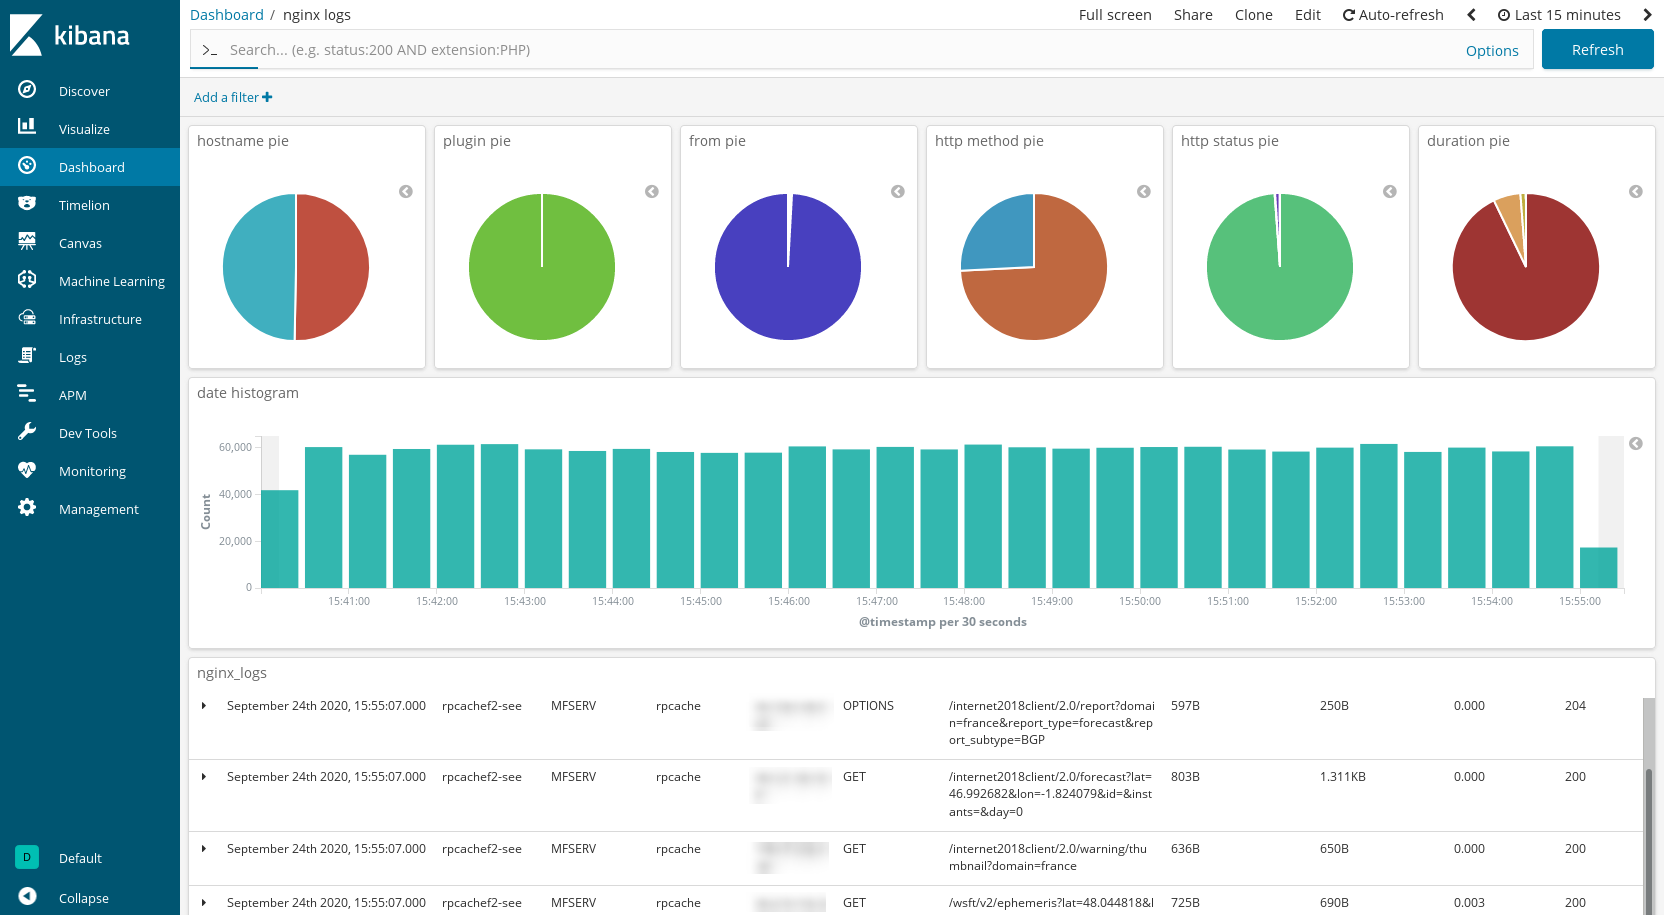
** A "nginx logs" dashboard in the "logs ui" provided with MFADMIN (of course, you can build/use your custom dashboards but we provide some interesting dashboards out of the box). **