Monitoring MetWork plugins
This section shows how to configure MetWork modules so that you can monitor your plugin and display dashboards through the tools offered in MFADMIN:
See also Create specific dashboards
1. Configuration
In order to monitor MetWork plugins, you have first to:
- install Metwork MFADMIN and MFSYSMON modules
- configure the
[admin]section and, optionally the[log]section of theconfig/config.iniin the root directory of the MetWork module (i.e. MFDATA, MFSERV, MFBASE,...),
Important
When you change a Metwork module configuration, you have to restart the corresponding Metwork module service (MFDATA, MFSERV, MFBASE, ...), e.g:
service metwork restart mfdata
1.1 Enable monitoring
To tell you want to monitor your plugins, first, set the hostname parameter value with the host name or IP address where MFADMIN is running:
[admin]
# null => no monitoring
# hostname=null
# By setting hostname = localhost, we assume MFADMIN is running on the same Linux machine,
# if MFADMIN is running on a different machine, set hostname = {your_host_name} or {your_host_ip_address}
hostname=localhost
# influxdb_http_port=18086
...
Important
If the above hostname parameter is not set or set to null, no monitoring will be available and no data will be displayed in the Grafana dashboards and Kibana dashboards.
By setting hostname, this will enable monitoring and the time-series metrics (by default). The metrics will be stored in the InfluxDB databases of the MFADMIN host. The corresponding dashboards will be available through Grafana on the MFADMIN host.
1.2 Enable monitoring based on standard logs and mflog logs
Now, if you want to monitor your plugins through mflog logs, in addition you have to set in the [log] section of the config/config.ini, the following parameters:
- the
send_mflog_logsparameter to1 - the
json_fileparameter toAUTO - the
json_minimal_levelparameter to the desired level
[log]
...
# If send_mflog_logs=1, send mflog logs to the configured admin hostname
send_mflog_logs=1

# duplicate some log messages in JSON to a specific file (for external monitoring tool)
# If json_file value is:
# null => the feature is desactivated
# AUTO => the json_file is @@@MFMODULE_RUNTIME_HOME@@@/log/json_logs.log if
#         [admin]/hostname != null else null (desactivated)
json_file=AUTO

# Minimal level for this json log file
# (DEBUG => everything,
#  INFO => everything but not DEBUG,
#  WARNING => everything but not DEBUG and INFO,
#  ERROR => everything but not DEBUG, INFO and WARNING,
#  CRITICAL => everything but not DEBUG, INFO, WARNING AND ERROR)
json_minimal_level=DEBUG
...
This will enable the standard logs and mflog logs to be stored in the ElasticSearch database of the MFADMIN host. The corresponding dashboards will be available through Kibana on the MFADMIN host.
In the above example, DEBUG logs will be duplicated (JSON format) in the log/json_logs.log file (in the root directory of the MetWork module user, e.g.mfadmin).
Notice the json_minimal_level parameter has nothing to do with the minimal_level parameter. This allows you monitoring plugins by filtering logs with a different level.
Important
If monitoring is not enabled, the above configuration will have no effect.
With mflog, you may add some attributes to the logger (refer to mflog example). These attributes will be logged and may be displayed in the Kibana dashboards.
1.3 Enable monitoring based on nginx access logs
Note
This section applies only on MetWork modules which embed nginx
If you want to monitor the nginx access logs, you have to configure the send_nginx_logs parameter in the the [log] section of the config/config.ini :
[log]
...
# If send_nginx_logs=1, send nginx access logs to the configured admin hostname
send_nginx_logs=1
...
This will enable the nginx access logs to be stored in the ElasticSearch database of the MFADMIN host. The corresponding dashboards will be available through Kibana on the MFADMIN host.
Important
If monitoring is not enabled, the above configuration will have no effect.
2. Grafana Time-series dashboards
Grafana dashboards are available from MFADMIN Grafana GUI Interface which is displayed through HTTP on http://{your_mfadmin_host}:15602(default login is admin/admin), e.g. http://localhost:15602.
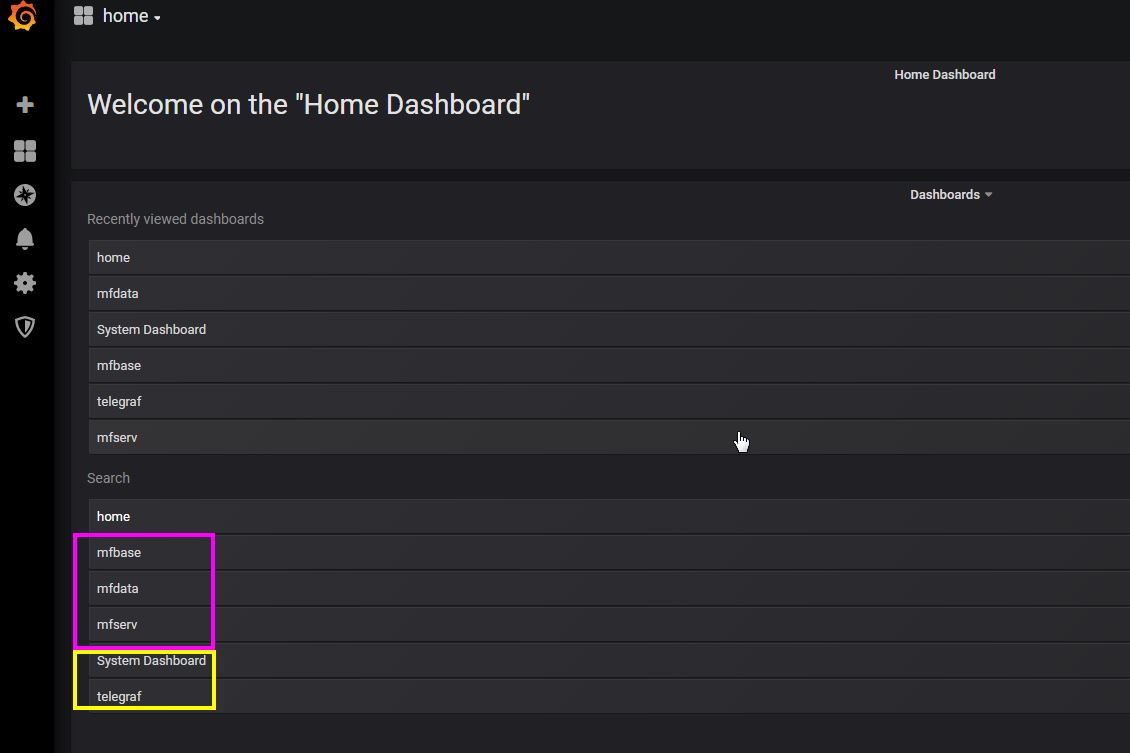
Then, click on the module you want display dashboards.
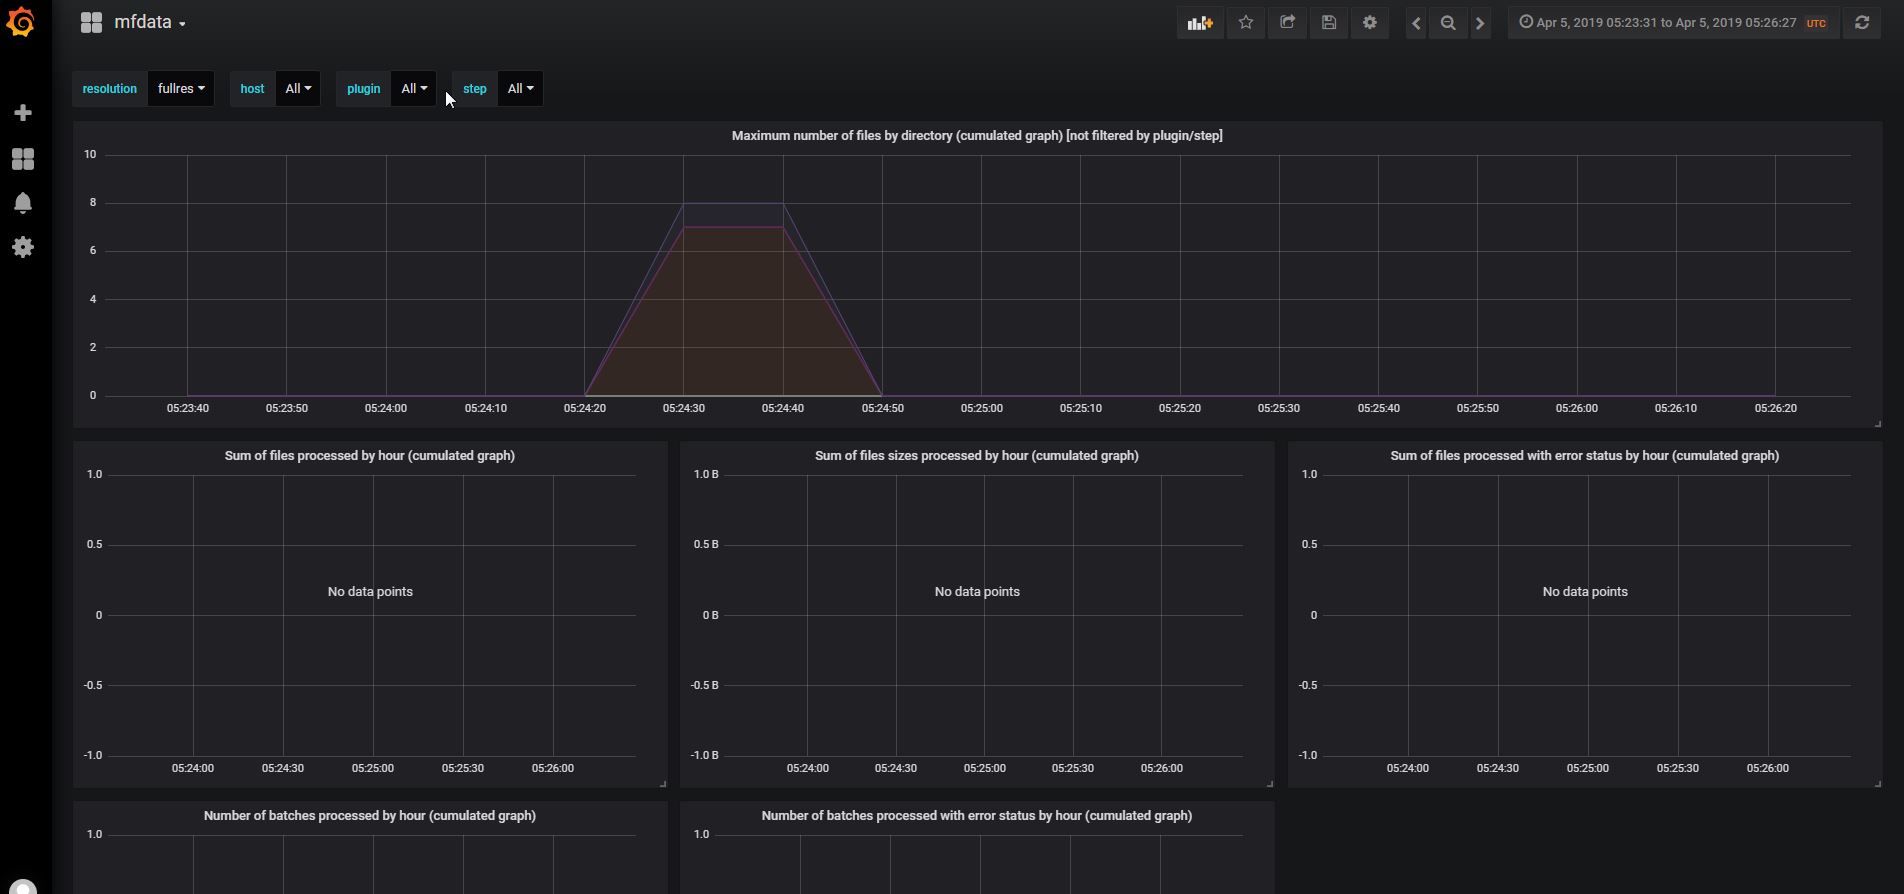
- Some default MFDATA dashboards:
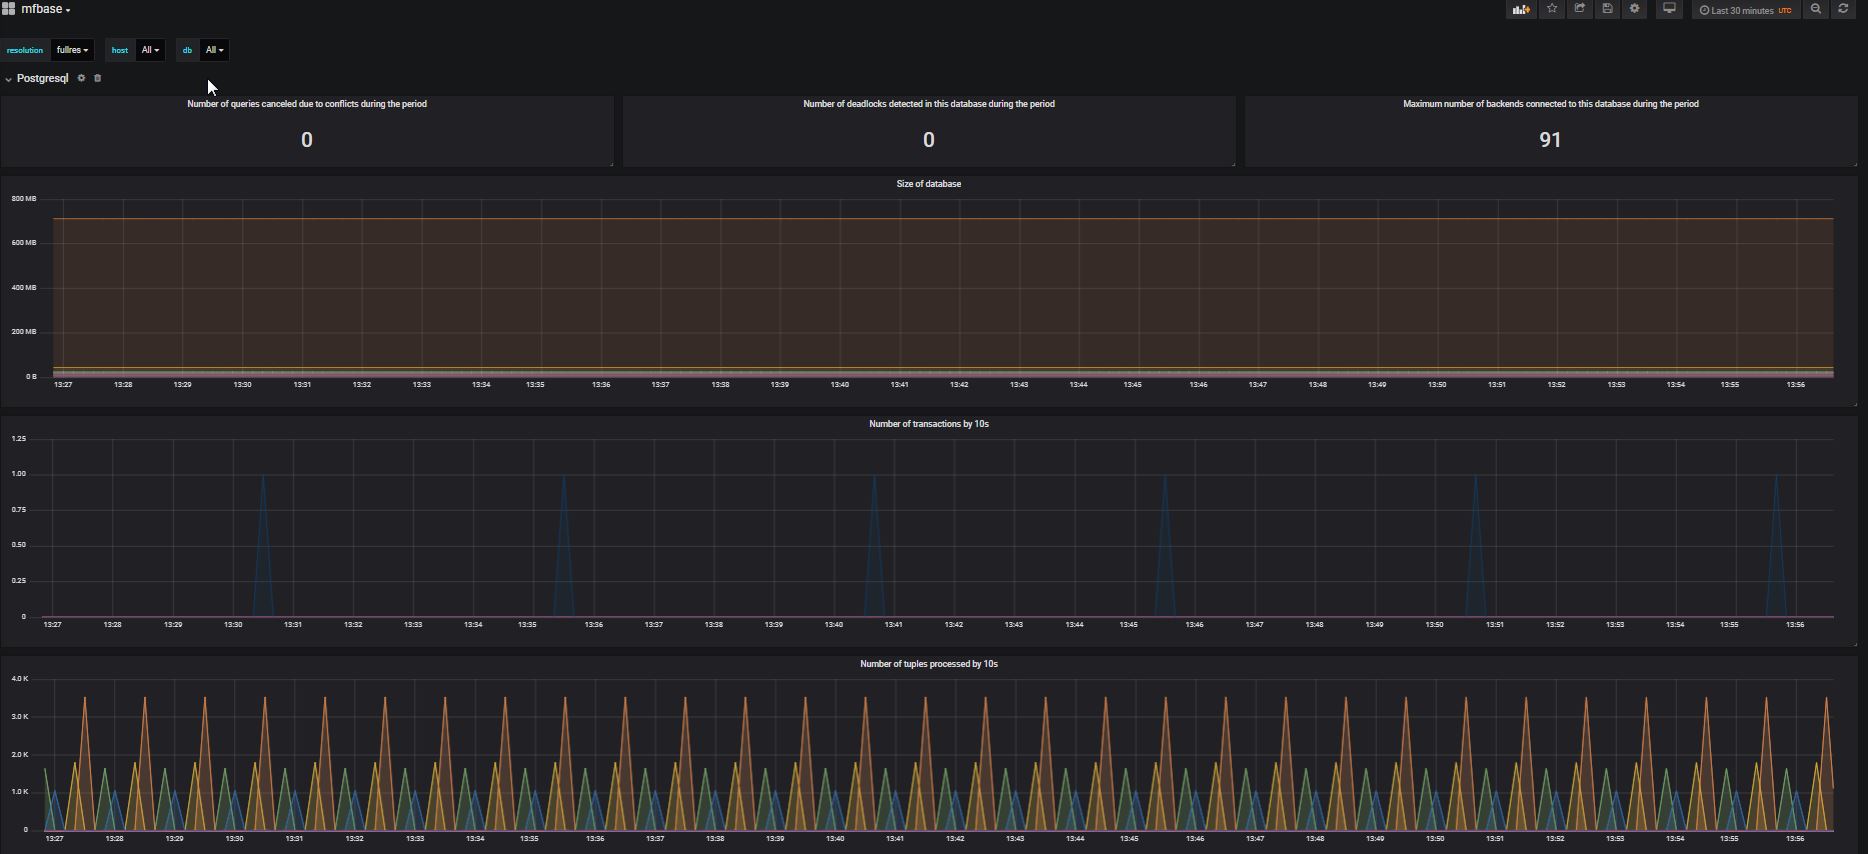
- Some default MFBASE dashboards:
Important
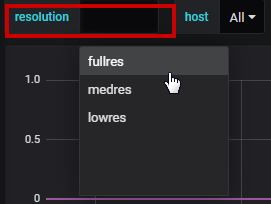
Grafana dashboards have a resolution parameter (retention policies).
You can choose which resolution to display. See InfluxDB retention policies and statistics aggregator for more details.
You may want to implement your own dashboard with specific metrics. In order to do this, you may refer to Create specific dashboards and Implement custom monitoring and metrics in a plugin.
You can implement your own dashboard from ElasticSearch database.
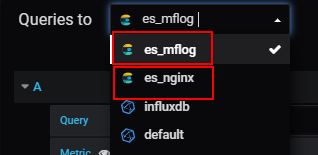
By default ElasticSearch mflog logs and ElasticSearch nginx access logs datasources are configured in Grafana.
When you create your Grafana query, select either the es_mflog or es_nginx datasource in the Queries to field.
See also:
3. Kibana dashboards
Kibana dashboards are available from MFADMIN Kibana GUI Interface which is displayed through HTTP on http://{your_mfadmin_host}:15605 from a remote host and also http://localhost:156054 from the MFADMIN local host. The default login is admin/admin.
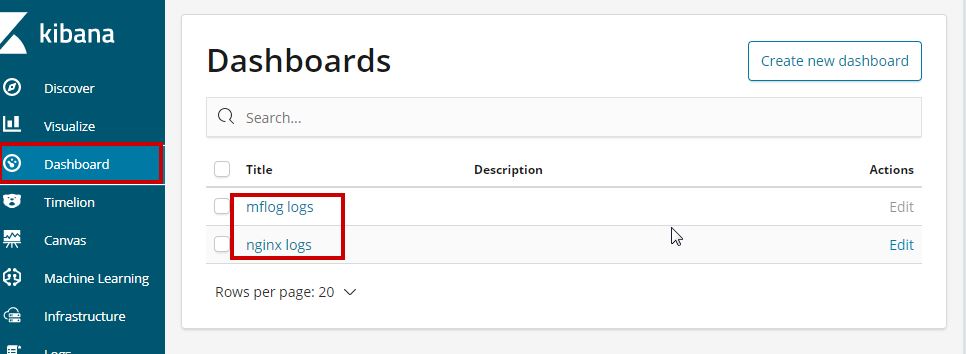
After you logged in to Kibana, click the Dashboard menu to select available dashboards to display.
The default dashboards provided by MetWork are:
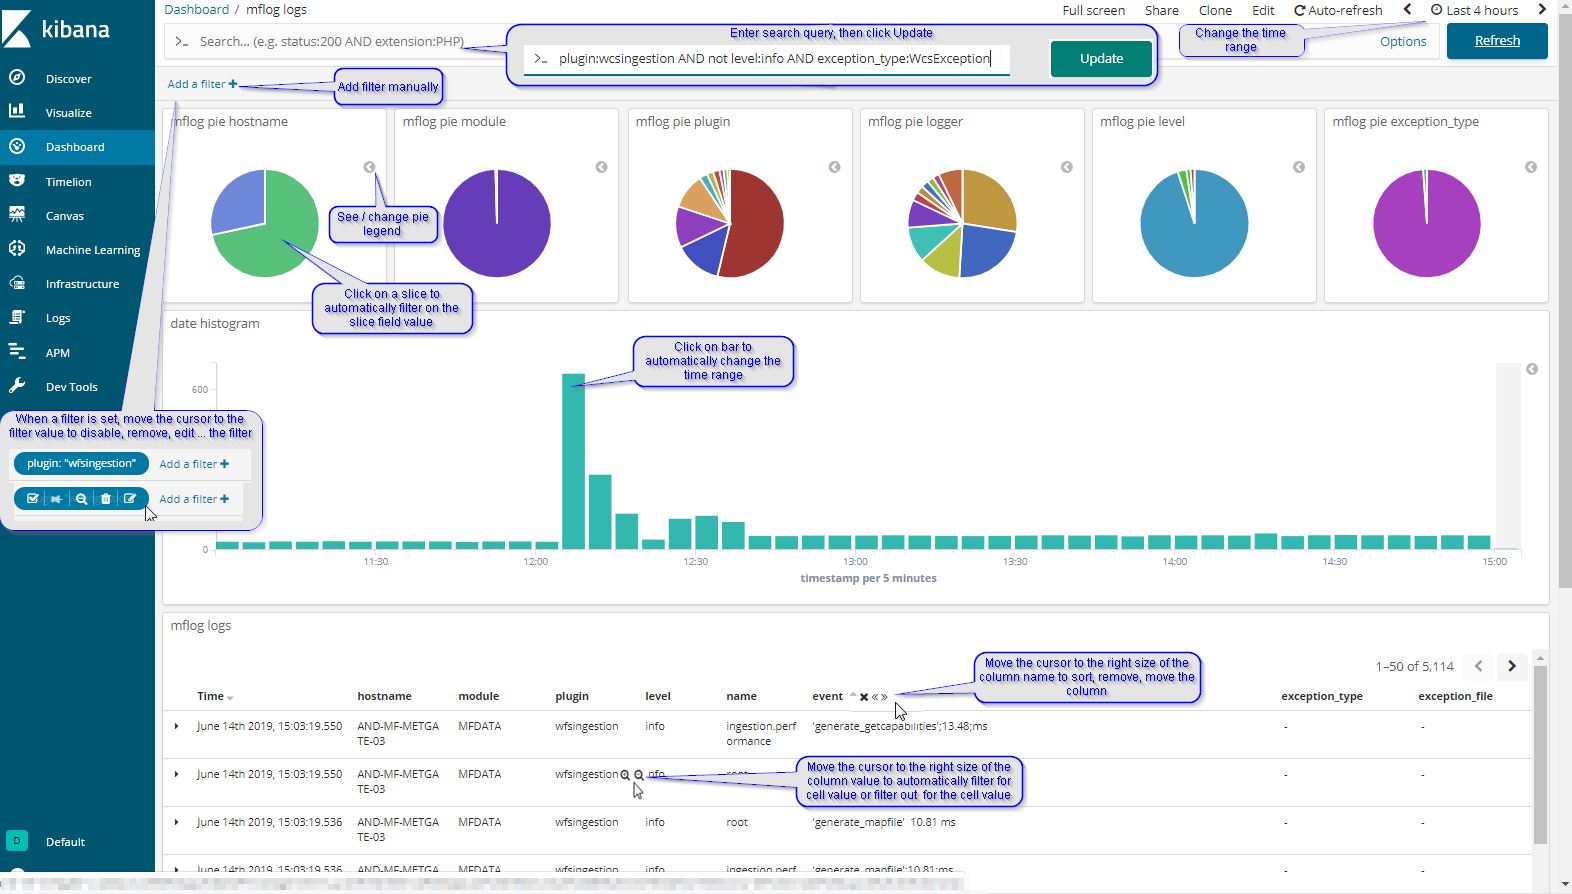
3.1 mflog logs dashboards example
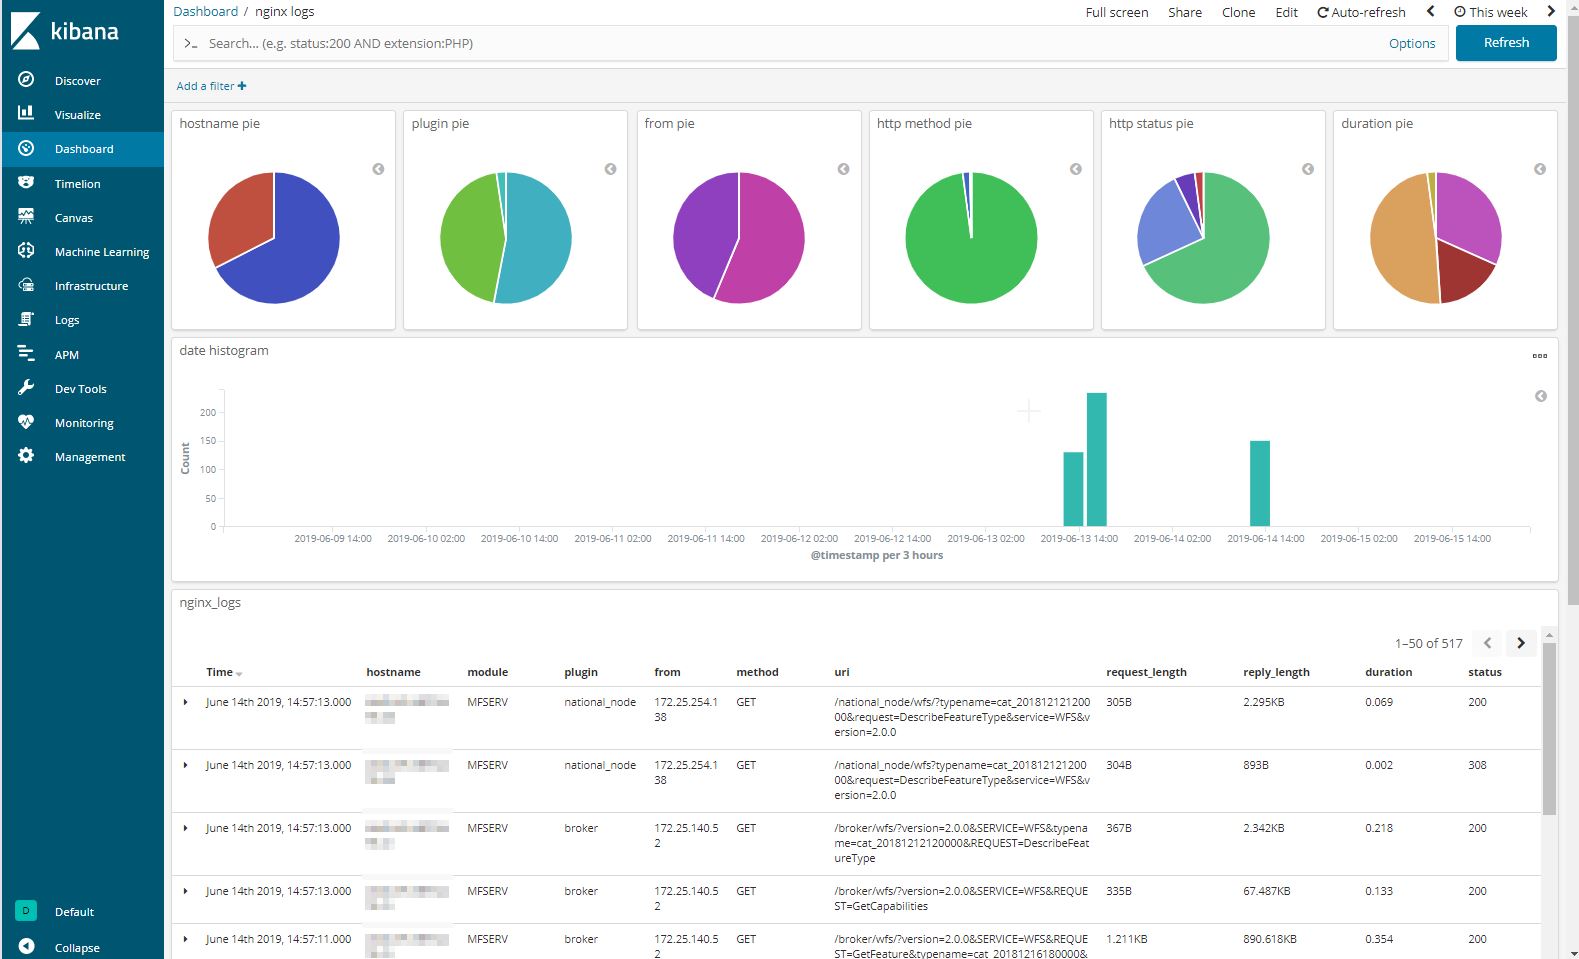
3.2 nginx logs dashboards example
nginx logs dashboards are similar to mflog logs dashboards, except data displayed.
3.3 Editing a Kibana dashboard visualization
In this section:
- we will add some attributes to the logger of the move_image plugin, based on the mflog example
- we will edit a Kibana
mflog logsdashboard visualization in order to add the added attributes to be displayed.
Edit the main.py script of the move_image plugin, and change as following:
#!/usr/bin/env python3

from acquisition import AcquisitionMoveStep
from mflog import get_logger


class Move_imageMoveMainStep(AcquisitionMoveStep):

    plugin_name = "move_image"
    step_name = "main"
    log = get_logger("move_image")
    log = log.bind(user="john")
    log = log.bind(user_id=123)

    def process(self, xaf):
        self.log.warning("user logged in", happy=True, another_key=42)
        return super().process(xaf)


if __name__ == "__main__":
    x = Move_imageMoveMainStep()
    x.run()
Open the MFADMIN Kibana GUI Interface and display the mflog logs dashboard.
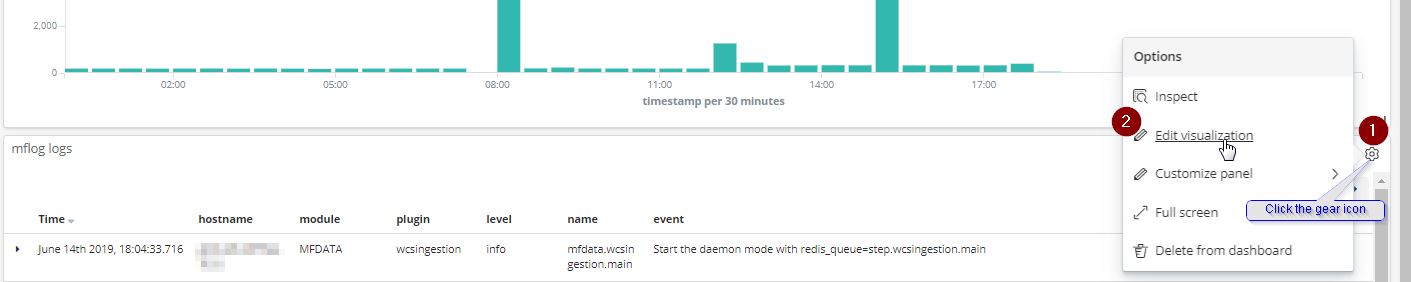
In the menu bar, click Edit.
To edit a visualisation of a panel, click the gear icon in the upper right. So, click the gear icon in the upper right of the mflog logs panel:, then click edit visualization:
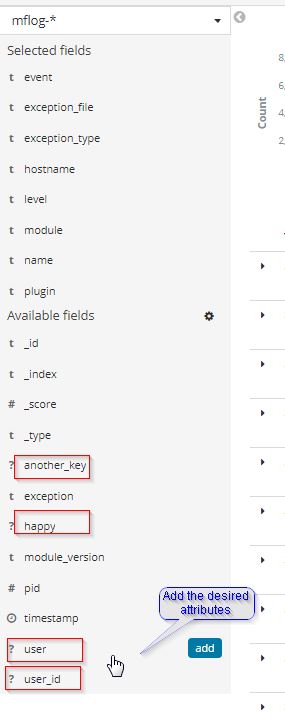
Add the attributes:
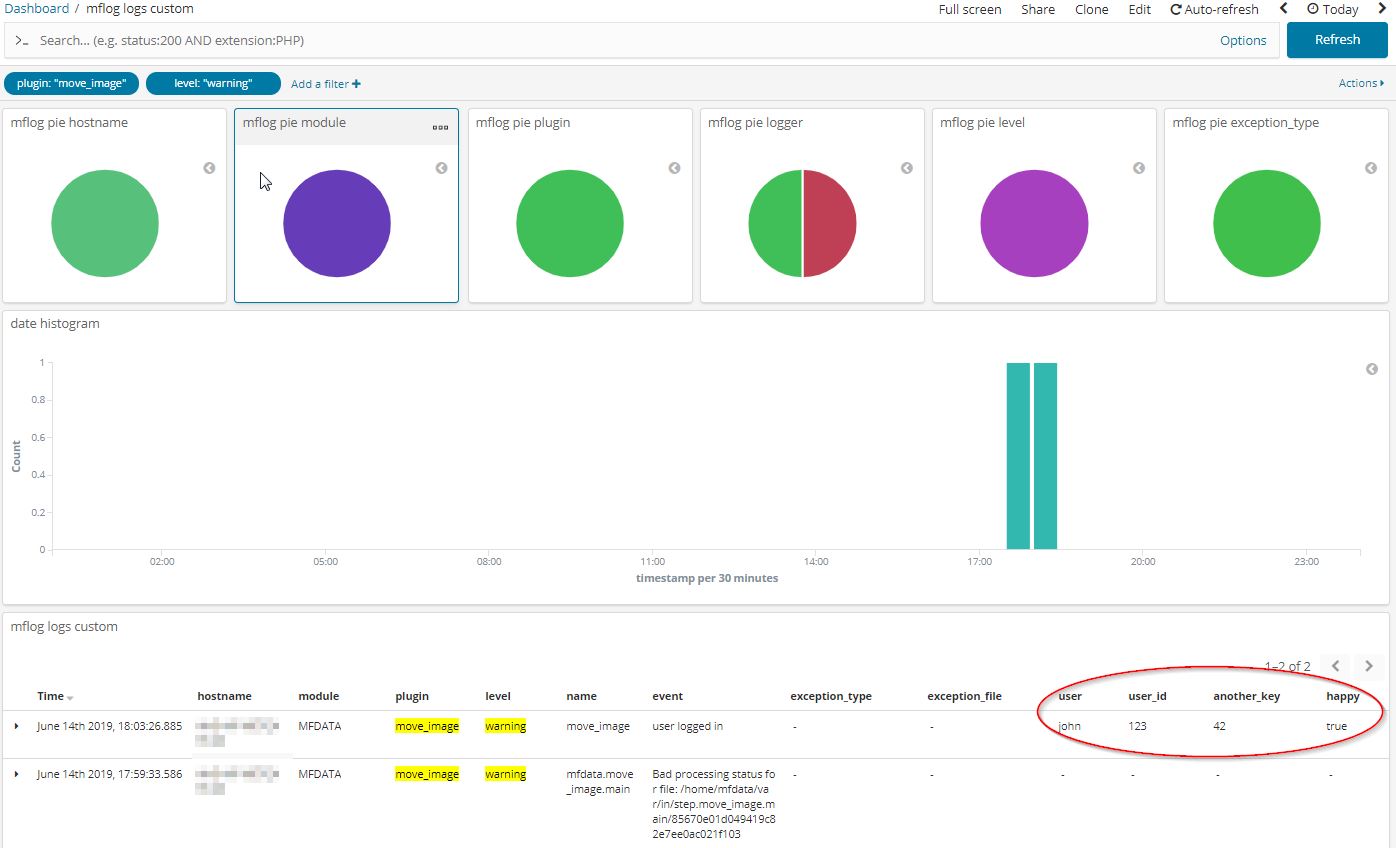
Click Save in the menu bar, and enter a new name, e.g. mflog logs custom
Add filters: plugins:"move_image" and level:"warning":
See also
For further, refer to Kibana documentation
Note
You may edit any Kibana dashboards, either data table or graphs.