Debug a plugin
1. Application Log level
Log level is defined in the [log] section of the ~/config/config.ini file of the module.
The most important parameter is:
- minimal_level: log level in production environment. default value is
INFO
You can change the log level. After changing it, you have to stop and start MFSERV to reload the configuration, by entering the commands :
-
either
mfserv.stop mfserv.start -
or (as root user)
service metwork restart mfserv
See also:
2. Nginx Access Log
Nginx writes logs information in the access log regarding each request made by a client.
By default, these access logs are enabled. But you can prevent Nginx Access Log from being written by setting logging parameter in the [nginx] section of the ~/config/config.ini file of the module:
# If logging=0, do not log anything in nginx_access.log
logging=1
3. Interactive debugger
An interactive debugger is available for some python plugins such as python3_flask, python3_django...
In order to show you how it works, follow the instruction below.
Create a plugin with the default (flask) template
bootstrap_plugin.py create testdyndebug
Set the debug parameter to 1 (instead of 0) in the [app_...] section of the plugin config.ini file:
# If you set debug=1, numprocesses will be forced to 1 and we will try
#   to set all debug options and features (max_age will also be forced
#   to 0 and mflog minimal level will be set to DEBUG)
# DON'T USE IT ON PRODUCTION!!!
debug=1
Then, when your plugin is created, edit the main/wsgi.py script an raise intentionally an error:
import os
import mflog
from flask import Flask, render_template

app = Flask(__name__)
if os.environ.get('MFSERV_CURRENT_APP_DEBUG', '0') == '1':
    app.config['PROPAGATE_EXCEPTIONS'] = True
logger = mflog.get_logger(__name__)


@app.route("/my_plugin/")
def hello_world():
    logger.info("This is an info message")
    x=1/0
    return "Hello World !"
Build the plugin by entering the make develop command.
Then, run and check your application from a browser by entering the application url http://{your_host_name}:18868/testdyndebug (e.g.: http://localhost:18868/testdyndebug)*[]:
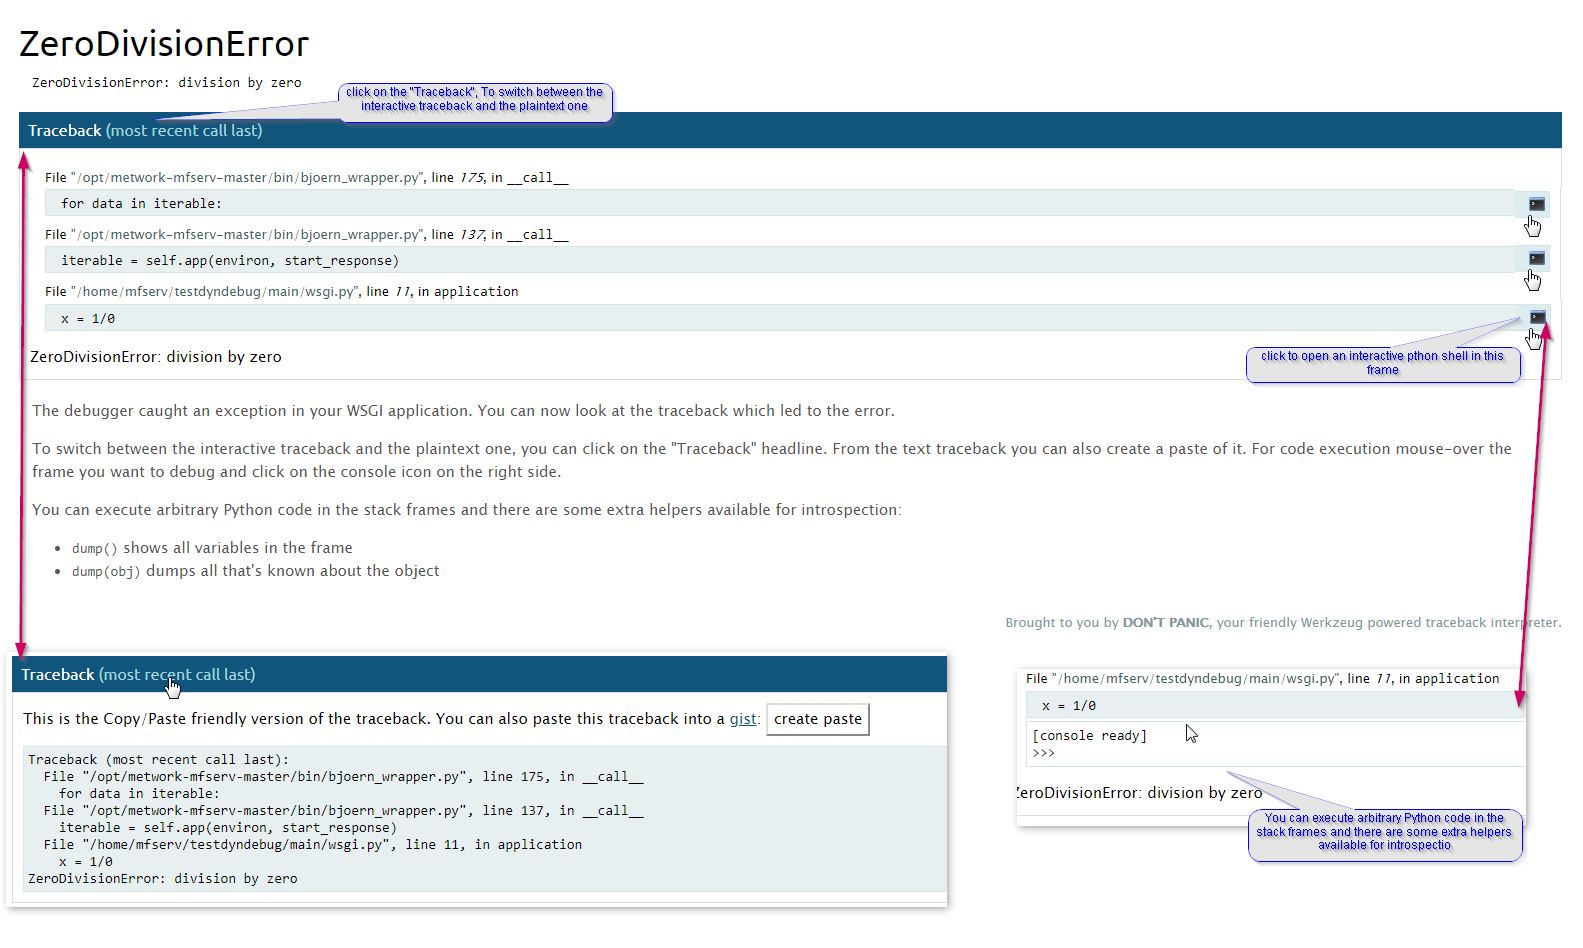
You should see an HTML page containing the stack trace of the application error like this:
Note
If you are running a Django project plugin, the debug HTML page is sightly different and you can't execute arbitrary python code in the stack frames.
4. Entering the plugin environment
In some cases, you would like to run commands from your plugin environment, e.g. django command line.
In order to do this, run the command plugin_env from the root directory of the plugin.
Then, you have entered the environment of your plugin and you are able to run commands through a command line in this plugin environment.